PHIT Data Hub™ · Burn Prevention & Awareness

Burn-Safety Score Card
A county health-leader cockpit

Turn burn advocacy into a defensible number. Enter what you know about your county across five pillars — prevention, first aid, burn-center access, protecting kids, and community data — and watch a weighted 0–100 Burn-Safety Score and letter grade update live. Built on Gayle Petrillo’s memoir The Accident, and on free, county-mappable federal data.

Official FFH Partner Module — The Accident Official FFH Partner Module
5Score Pillars
~120KKids in EDs / yr
50%+2+ hrs from a Burn Center
5Free Federal Datasets
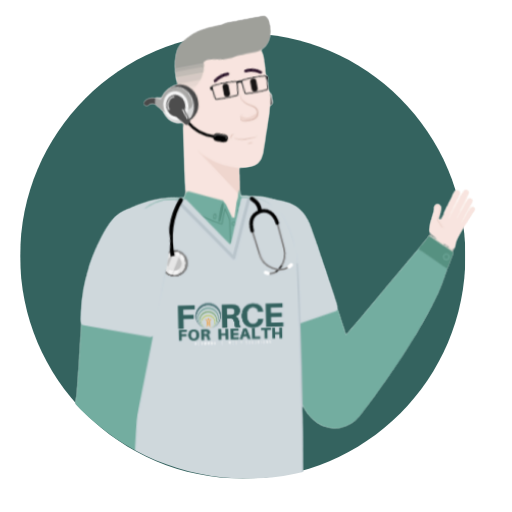
Dr. Rob, clinical & data host
Dr. Rob
Your clinical & data host

Welcome, County Health Leader. This cockpit is a tool, not a game — it turns scattered burn facts into one score your county board can act on. Start with the values you already have; every field has a sensible default so you always see a working number.

How to use it with a board: project the score, walk the five meters top to bottom, and stop on your weakest pillar — the auto-written narrative names it for you. Then point to the Free Data panel to show the numbers are public and pullable, and to the Grant Hook to frame the ask. Print the whole thing as your one-page leave-behind.

Enter what you know · the score updates live

Your county Burn-Safety cockpit

Sliders and toggles across the five pillars. Defaults reflect rough national gaps — replace them with your county’s real figures from WISQARS, HCUP, NFIRS and your ED partners.

1
Prevent
Weight 25%
Home & scald safety — the highest-ROI place to stop a burn before it happens. Set water heaters to 120°F: at 140°F a child scalds in ~5 seconds; at 120°F it takes ~10 minutes.
88%
45%
2
Cool & Care
Weight 15%
First aid literacy. For ANY burn: cool running water for about 20 minutes — no ice, no butter, no toothpaste. Knowing this one rule changes outcomes.
32%
3
Get to a Burn Center
Weight 25%
Access. Verified burn centers reach ~97.7% survival — but over half of Americans live 2+ hours from one, and fewer than 40 of ~75 verified centers are pediatric-verified.
95 min
4
Protect the Vulnerable
Weight 20%
Kids & abuse screening. About 120,000 children under 21 are treated in U.S. EDs for burns yearly, and roughly 1 in 10 pediatric burn admissions involves abuse — screening protocols save lives.
130
5
Advocate
Weight 15%
Community & data. A free smoke-alarm drive with your fire department is one of the highest-ROI things a county can do — and mapping burn data locally is what moves funding.
County Burn-Safety Score
0/ 100
F Needs work
The five pillars at a glance

Pillar summary

Each bar is that pillar’s 0–100 sub-score before weighting. The shortest bar is where a board dollar buys the most safety.

Free data to pull this in

Every number here is free & county-mappable

Burn and fire data is public. These five federal sources let you replace the defaults above with your county’s real figures — no license fee, no gatekeeper.

CDC WISQARS
Free & public

Web-based Injury Statistics Query & Reporting System. Nonfatal and fatal burn/fire injury counts and rates by age, intent and mechanism — the backbone of your pediatric burn-visit numbers.

Feeds → Pillar 4 (ped ED visits)
CDC WONDER
Free & public

Wide-ranging ONline Data for Epidemiologic Research. Underlying-cause mortality including fire/flame and scald deaths, queryable down to county — the severity tail behind the ED counts.

Feeds → Pillar 4 · severity context
HCUP
Free & public

Healthcare Cost & Utilization Project. Hospital inpatient and ED encounter data — burn admissions, charges and length of stay that turn a burn count into a dollar cost for the grant case.

Feeds → Pillar 4 · Grant Hook
NFIRS (fire incidents)
Free & public

National Fire Incident Reporting System. Structure fires, causes and civilian injuries reported by local fire departments — ideal for targeting smoke-alarm drives and mapping risk.

Feeds → Pillar 1 & Pillar 5
NEMSIS (EMS)
Free & public

National EMS Information System. Prehospital records — response times, transports and burn calls — that ground your minutes-to-burn-center and access picture in real EMS activity.

Feeds → Pillar 3 (access)
The funding case

Federal burn-disaster planning names children as a priority. Your score is the number that qualifies you.

Federal burn-disaster and mass-casualty planning specifically emphasizes vulnerable populations, including children — which is exactly what a low Protect-the-Vulnerable or Access pillar documents. A Burn-Safety Score turns that emphasis into a defensible, sourced ask.

With about 120,000 children under 21 treated in U.S. EDs for burns each year and a shrinking pediatric burn-surgeon pipeline, a county that can show its gap on paper is the county that gets funded. Pair this score with HCUP cost data to put a dollar figure on inaction.

$1.5M+
Illustrative range for a multi-year county burn-prevention & pediatric-access initiative — smoke-alarm drives, ED screening protocols and transport planning. Size it to your county with HCUP cost data.
On the number: the $1.5M figure is an illustrative planning range, not an award amount. The defensible, citable facts are the ones grounded above — ~120,000 pediatric ED burn visits/year, 50%+ of the population 2+ hours from a verified burn center, and the federal emphasis on children in burn-disaster planning. Localize the dollar figure with HCUP.
How the score works

Each pillar produces a 0–100 sub-score, then the pillars are combined with fixed weights into the overall Burn-Safety Score. Weights reflect leverage: prevention and burn-center access carry the most, because that is where outcomes move most.

PillarWeightInputs → sub-score
1. Prevent25%Average of two percentages: working-smoke-alarm % and water-heater ≤120°F %.
2. Cool & Care15%The “cool water ~20 min” awareness % directly.
3. Get to a Burn Center25%60% time-to-center (100×(120−min)/90, clamped 0–100) + 40% pediatric-center-within-2h (yes=100/no=0).
4. Protect the Vulnerable20%50% pediatric ED rate (100×(250−rate)/200, clamped) + 50% ED abuse-screening protocol (yes=100/no=0).
5. Advocate15%50% free smoke-alarm program + 50% burn data mapped (each yes=100/no=0).
Overall100%Weighted sum → letter grade.

Letter grades: A ≥ 90, B ≥ 75, C ≥ 60, D ≥ 45, F < 45. The band cutoffs are deliberately demanding: a composite in the 30s–40s is common for a county with real gaps, and the point of the tool is to show where to close them, not to hand out easy A’s.

This is a decision aid, not a clinical instrument. The weighting is a defensible starting model your county can adopt as-is or adjust with your board — document any change so the score stays comparable over time.
One story. One score. One county at a time.

Gayle Petrillo’s The Accident teaches that a single tipped hot drink can change a life — and that awareness is a superpower. This Score Card turns that lesson into the number your board can fund.

Explore the Burn Module Read “The Accident”